Introduction
If like myself, you are working with missing values in time series data and can’t drop those instances, here’s a tutorial for how to handle this by interpolating these missing values.

Types of Imputation
I want to preface this post with the fact that there are multiple ways you can impute missing values in your data, and I encourage you to do additional research as you see fit, but here are the two most common ways you’ll come across.
i. Imputation using Mean/Median/Mode
ii. Imputation by prediction (can go from very simple to more highly complex prediction models )
I will be using imputation by prediction as it’s a more robust/accurate way of imputing data.
Alright now let’s get into this:
For this tutorial to make sense you’ll need to understand the structure of the data I am working with.
Data
My data is made up of a list of countries (column name: Reporter) , and for each country, there is a record of the quantity, and trade value of the cocoa exported every year from 1999–2019, except every country is missing a record for 2017 as it was not present in the source where I got my data from and is why I’m here showing you how I imputed the missing value quantity and trade value for each country.
Sample data:
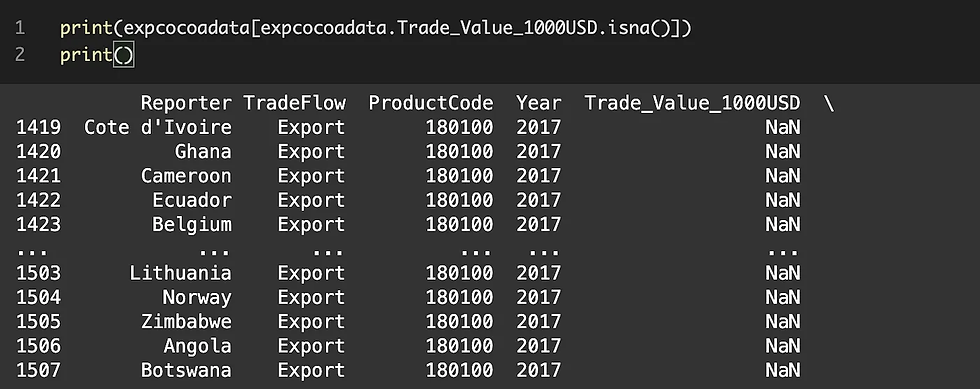
This data set has 5 columns (only 4 shown below) and for the purpose of this analysis I will be focusing on the missing values in the column ‘Trade_Value_1000USD”.

Analysis of missing data:
The column ‘Trade_Value_1000USD” is missing 89 values and these 89 missing values are for different countries in different years.

Imputation
To impute the missing data, I used the interpolate function with the slinear method from Pandas and created a helper function since I was using it multiple times across my project (See code in references)

Why use the ‘slinear’ method?
There are multiple methods you can use to interpolate data with the pandas interpolate function as you can see in the documentation for this function here. I narrowed down my choice to ‘slinear’ after imputing using every method on a smaller sample of my data where I created random missing values for comparison, and choosing the method that yielded the highest R-squared, and I am skipping this very important part for the sake of keeping this article short, but you should definitely explore other methods to find the one that fits your data best.
Results of imputation
Add screenshot of data summary statistics showing how many values are missing.
Conclusion
Here are key takeaways when using the pandas interpolate function to interpolate time series data;
Find the reason why your data has missing values and judge whether imputing them is the best option for your analysis.
Compare different interpolation method and select the one that yields the best results for your data (Compare using R-square values when intentionally creating random missing values)
Bear in mind that your interpolated values are only a proxy when reporting the results of your analysis.
Comments